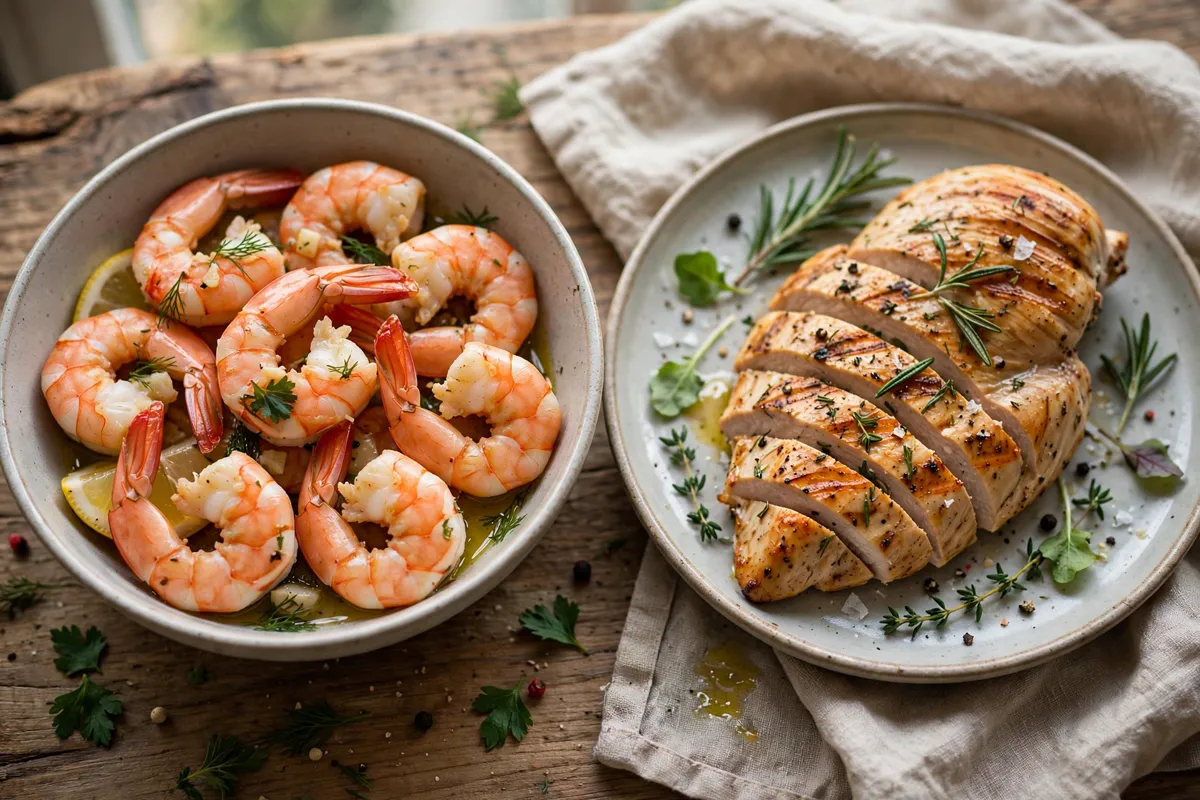
Chicken Protein Calculator: The Short Answer
Chicken has more protein than shrimp — chicken breast carries 31.02 grams of protein per 100 grams (USDA FDC ID 171477) against shrimp's 23.98 grams per 100 grams (FDC ID 175180), a clear seven-gram gap at equal weights. Shrimp is still an excellent protein food, and it wins a different contest: at 99 calories per 100g against chicken breast's 165, shrimp delivers its protein at a much lower calorie cost per portion. This article prices both contests so you know which one you are actually entering.
The confusion usually comes from shrimp's reputation as pure protein. It nearly is — 0.28g fat and 0.2g carbohydrate per 100g make it one of the leanest entries in the seafood case — but leanness and density are different properties. Density asks how much protein sits in 100 grams of food; shrimp's 100 grams simply hold more water and less muscle protein than chicken breast's 100 grams. Both foods convert portion by portion in the chicken protein calculator style of weight-first pricing used throughout this series. Fish protein is worked out on its own page.
Short Answer
Chicken breast has more protein: 31.02g per 100g against shrimp's 23.98g per 100g — about 29% more at equal weight. Shrimp has fewer calories: 99 per 100g against 165. Per 100 calories, shrimp gives about 24.2g protein and chicken about 18.8g, so shrimp wins on efficiency while chicken wins on density.
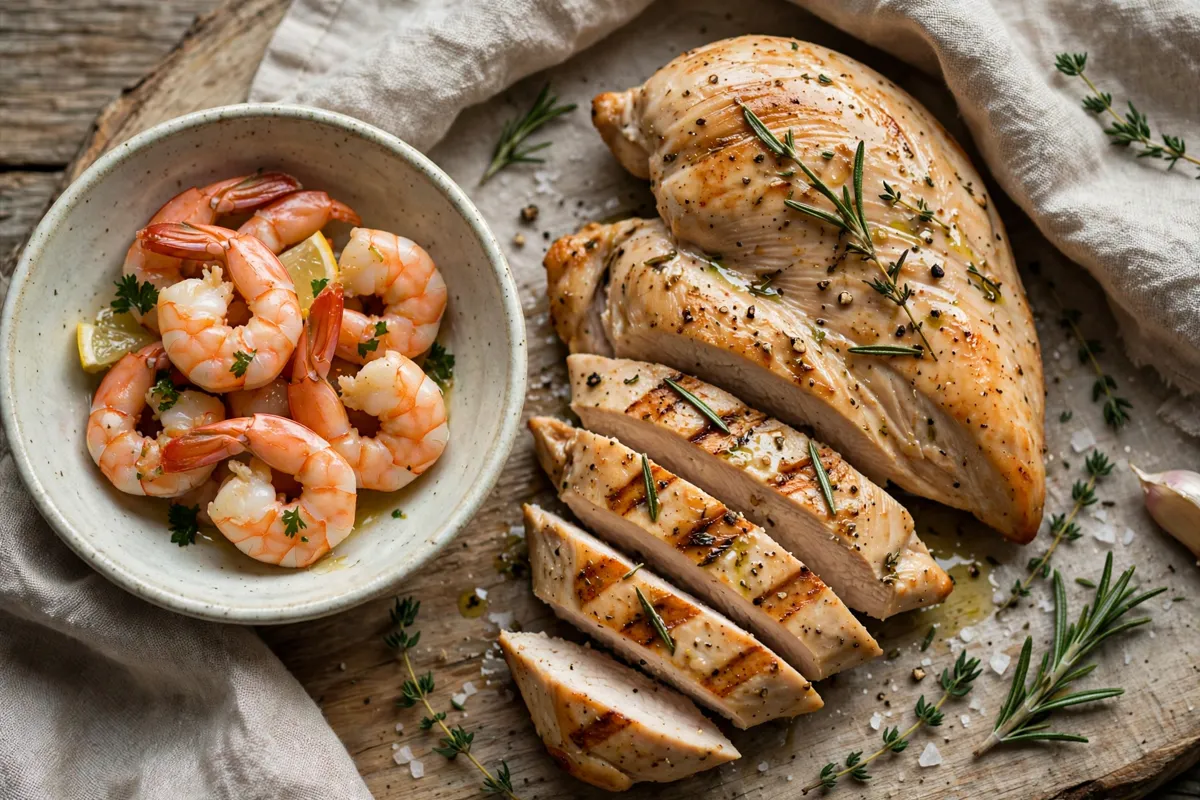
What Are the Full Numbers for Shrimp and Chicken Breast?
Chicken breast, boneless and skinless, cooked roasted (FDC 171477), per 100 grams: 165 calories, 31.02g protein, 0g carbohydrate, 3.57g fat, 74mg sodium and 256mg potassium. Shrimp, cooked (FDC 175180), per 100 grams: 99 calories, 23.98g protein, 0.2g carbohydrate, 0.28g fat, 111mg sodium and 259mg potassium. Potassium is a virtual tie (259mg against 256mg), sodium favours chicken modestly (74mg against 111mg), and fat favours shrimp overwhelmingly — less than a tenth of chicken's already-lean figure.
One data caution belongs here. An older USDA moist-heat shrimp entry exists in which shrimp treated with moisture-retention additives reads 947mg sodium per 100g — a processing artefact, not a property of shrimp itself. The headline entry used here (175180) is the plain cooked shrimp figure at 111mg sodium, and it is the right basis for plain shrimp cooked at home. Restaurant shrimp soaked or brined for texture can drift toward the treated profile, which is a preparation question, not a species question. Does cooking method change chicken protein works through the same plain-versus-treated distinction on the poultry side.
Which One Wins Per Serving, Not Just Per 100 Grams?
Servings narrow the headline gap, because the foods are portioned differently. Chicken's reference half-breast portion (86g) derives to 141.9 calories and 26.7g protein. Shrimp's reference 3-ounce serving (85g) derives to about 84.2 calories and 20.4g protein (85 × 0.99 and 85 × 0.2398). The chicken portion still leads on protein — by about 6.3 grams — while costing about 57.7 more calories. A cook who plates shrimp generously, as shrimp is usually plated, closes the protein gap quickly: 125 grams of shrimp derives to about 30.0g protein at about 123.8 calories, matching a full chicken portion's protein at fewer calories than the 86g chicken serving itself.
That is the practical heart of the comparison. At fixed weight, chicken wins. At fixed calories, shrimp wins. At the plate, where shrimp portions run large and chicken portions run modest, the two land close enough that variety, price and preference can decide without the protein suffering. The per-ounce chicken ladder in how many calories are in 3 ounces of chicken lets you scale the chicken side to any shrimp weight you are comparing against.
When Should You Choose Shrimp, and When Chicken?
Choose shrimp when the calorie budget is the binding constraint: a dieter who needs 30 grams of protein for about 124 calories gets it from 125 grams of shrimp, a trade chicken breast cannot match at any weight, since chicken needs about 148 calories to deliver the same 30 grams (97g × 1.65). Choose shrimp also for speed — it cooks in minutes — and for the near-zero fat that lets the rest of the plate carry richer ingredients.
Choose chicken breast when density is the constraint: when the plate is small, the meal must travel, or a large protein target (40 to 50 grams) must fit inside one modest portion. Chicken's 31.02g per 100g reaches 40 grams of protein at about 129 grams of meat; shrimp needs about 167 grams for the same 40 grams (40 ÷ 0.2398 × 100). Chicken is also the steadier budget choice per gram of protein in most shops, though prices vary too much by place and season for a universal claim — check your own shelf prices against these per-100g protein rates to price the contest locally. Either food, weighed and priced by weight in the chicken protein calculator, holds up as a protein anchor; the data simply refuses to crown one winner for every purpose.
How Do You Hit a Target With Either Food?
The conversion is the per-100g rate inverted, and it is worth doing once for your usual target:
Every row shows the same trade in miniature: shrimp's calorie advantage grows with the target, while chicken's weight advantage does too. A mixed week — chicken on training days when the target is high, shrimp when the day needs lightness — captures both advantages without loyalty to either.
- For 25g protein: about 81g chicken breast (about 133 calories) or about 104g shrimp (about 103 calories)
- For 30g protein: about 97g chicken breast (about 160 calories) or about 125g shrimp (about 124 calories)
- For 40g protein: about 129g chicken breast (about 213 calories) or about 167g shrimp (about 165 calories)
- For 50g protein: about 161g chicken breast (about 266 calories) or about 209g shrimp (about 207 calories)
How Do the Two Behave in Real Meals?
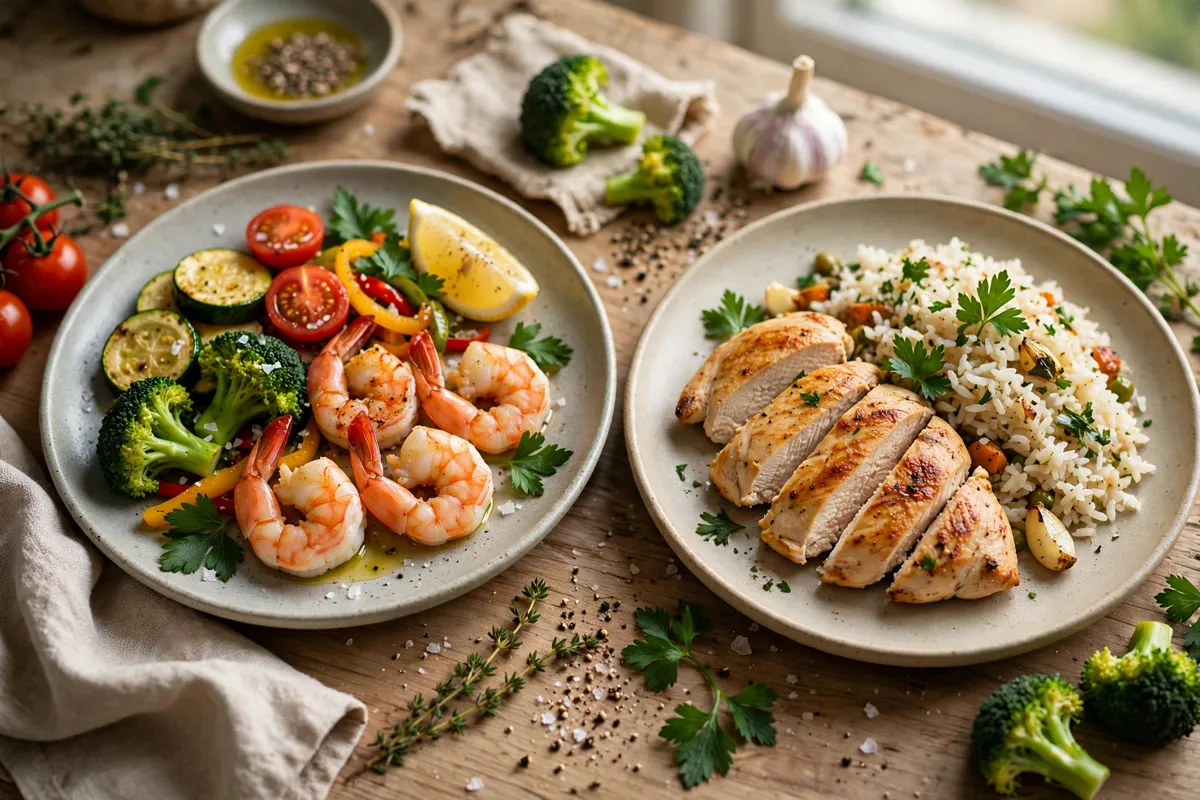
In a salad, a wrap or a stir-fry, the comparison stops being abstract. A 3-ounce shrimp serving (85g) folded through a salad derives to about 84.2 calories and 20.4g protein — the lightest full protein layer in this series — leaving most of the plate's budget for grains, cheese or dressing chosen on purpose. The same salad built on 3 ounces of chicken breast derives to 140.3 calories and 26.4g protein: six more grams of protein for 56 more calories. Neither build is wrong; they are different allocations of the same budget, and a week that uses both gets shrimp's lightness on the days the dressing is rich and chicken's density on the days the plate is plain. The one allocation to avoid is the unexamined swap — logging chicken's numbers for a shrimp portion, or shrimp's calorie figure for a chicken portion — because at these gaps (about 7g protein and 66 calories per 100g) a daily swap quietly rewrites a month of logs.
Common Mistakes to Avoid
- Declaring shrimp "higher protein" from its lean reputation — per 100g it trails chicken breast by about 7 grams
- Comparing a restaurant shrimp portion with a weighed chicken portion — portion size, not species, explains most real-plate differences
- Using treated-shrimp sodium figures (947mg per 100g in the additive entry) for plain home-cooked shrimp, which sits at 111mg
- Forgetting that dipping sauces, butter and breading are separate foods — the plain entries here exclude them all
- Pricing shrimp raw against chicken cooked — both entries in this article describe cooked food
Final Thoughts
Chicken has more protein than shrimp per 100 grams — 31.02g against 23.98g — and shrimp returns the favour per calorie, 99 against 165 per 100g. The winner depends on which budget binds you: weight on the plate, or calories in the day. Weigh either food, convert with its verified rate, and both serve a protein plan faithfully; the chicken side of every comparison scales in the chicken protein calculator.
People Also Ask
Does Chicken or Turkey Have More Protein?
Chicken has more protein than turkey — by a hair: chicken breast carries 31. 02 grams of protein per 100 grams (USDA FDC ID 171477) against turkey breast's 30. 13 grams per 100 grams (FDC ID 171496), both cooked, roasted and meat only.
Which Has More Protein, Chicken or Steak?
Chicken breast has more protein than steak — narrowly: 31. 02 grams per 100 grams for cooked chicken breast (USDA FDC ID 171477) against 30. 55 grams per 100 grams for broiled top sirloin steak, lean only (FDC ID 168634).
What Are the Best High-Protein Snacks Under 200 Calories?
The best high-protein snacks under 200 calories are anchored on Greek yogurt, tuna, cottage cheese, eggs and edamame — in that order of protein density. A Greek yogurt pot delivers about 17 grams of protein for about 100 calories, a tuna pouch about 16 grams for about 110 calories, and a small protein shake 20 to 25 grams for 120 to 150 calories. Paired with berries, cucumber or tomatoes, those anchors build complete snacks at 125 to 160 calories carrying…
How Much Protein Should a Snack Contain?
A snack that is meant to hold you should contain 10 to 20 grams of protein. Below 10 grams, the snack is a treat that returns as hunger within the hour; above 20 grams, it is a meal that breaks the snack budget. Inside the band, the quality check is protein's share of the snack's calories: at or above about 25 percent marks a genuine protein snack.